



Build smart, manage risk, stay ahead

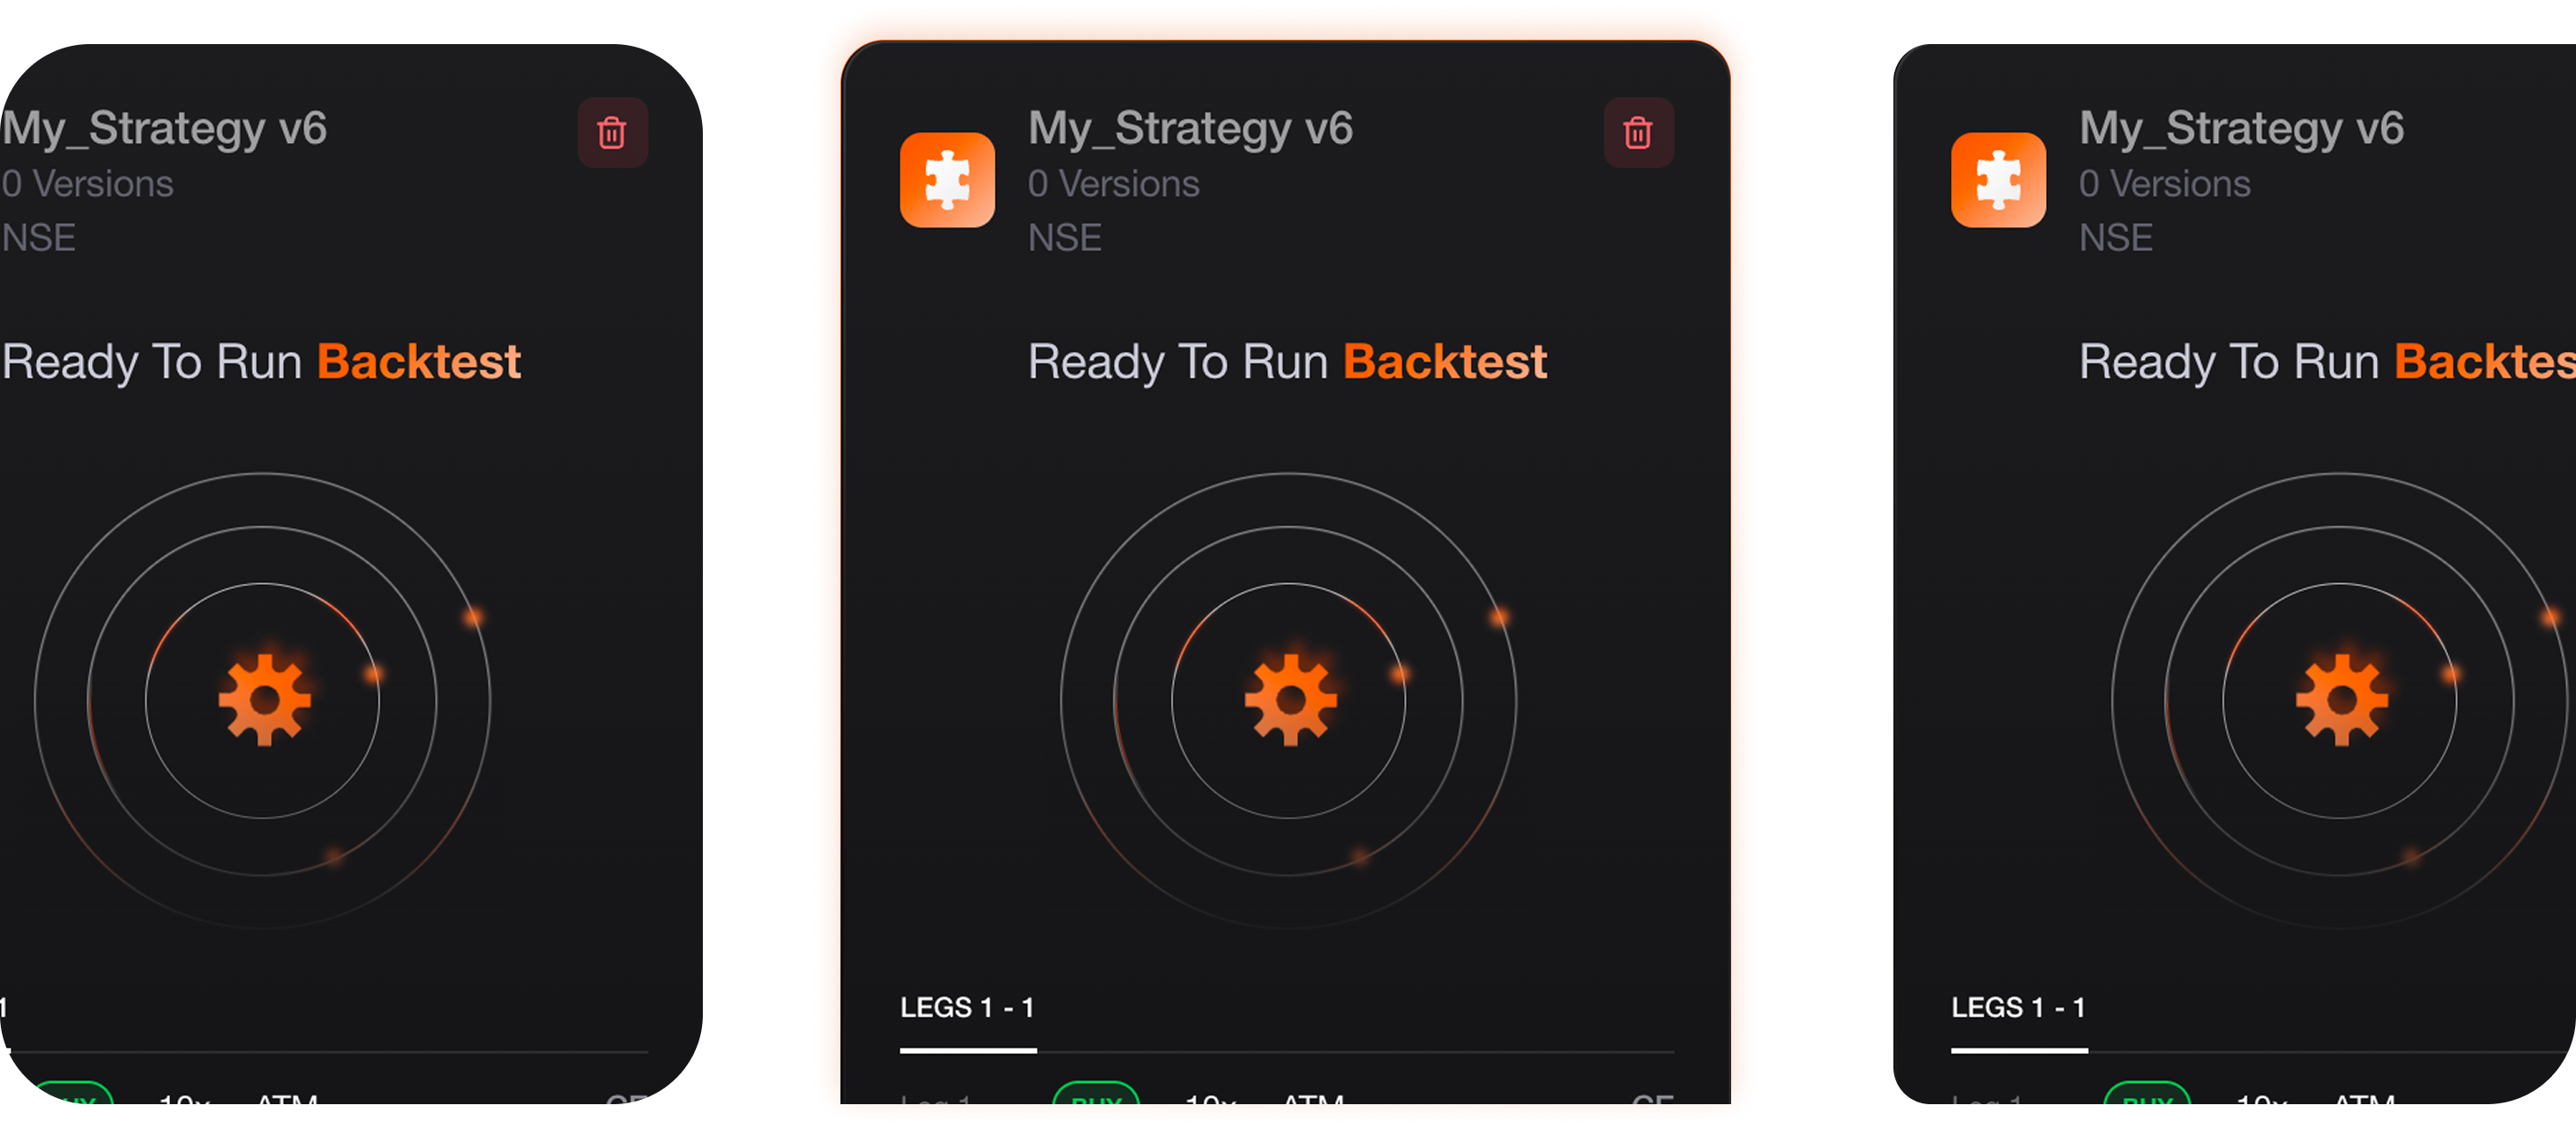
Backtest strategies with payoff graphs, probability of profit, P&L tables and greeks — refine your rules on real historical data before risking a single rupee.

DayMonthYear
13 May 2026

Intraday P&L Chart

i
Entry / Exit
09:20 – 15:15
Day P&L
−₹65
Max Profit
₹3,374
Max Drawdown
−₹6,260
Pre-entry Spot price84% · drag to pan−+↺⤢
P&L Spot Price Entry Exit Pre-Entry
CONFIGURE COLUMNS
›⤢
Position SnapshotSpot 23,410
Fut 23,410
12:19
12:19
No event at this time
Net
−₹666
Contract InfoLTPEntryP&LGamma
#123450CESELL
65 QTY · May 19, 2026
255.00230.00−665.650.000656

Advanced Strategy Builder

Build strategies using payoff graphs, charts, probability of profit, P&L tables, greeks and more.

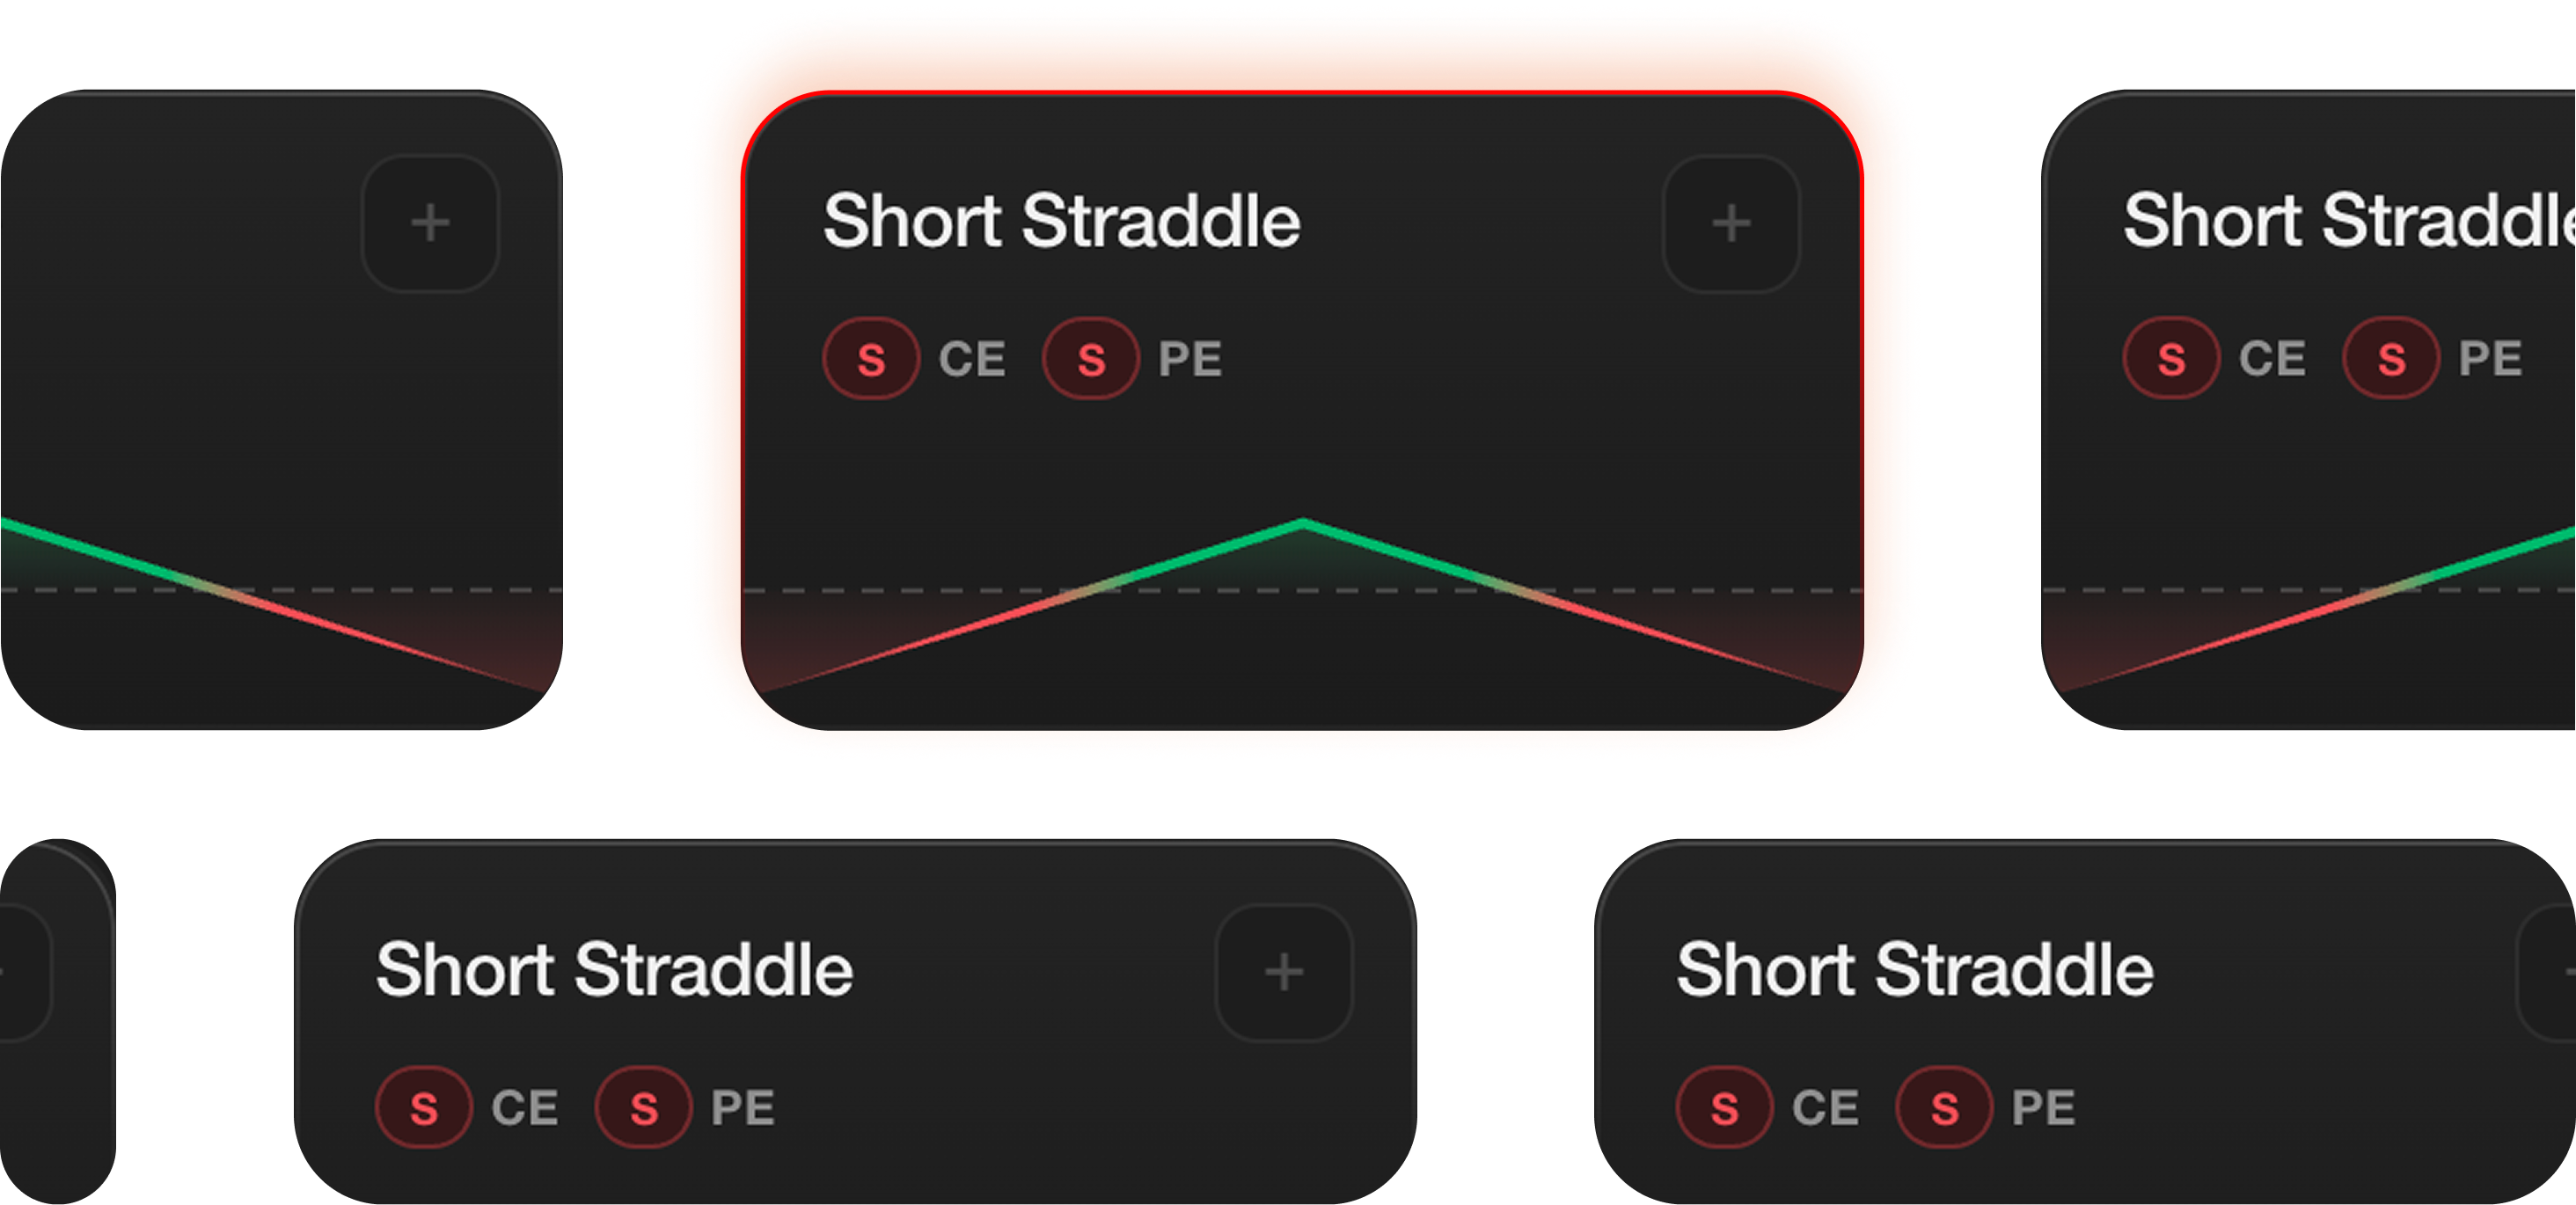
Ready-Made Strategies

Select from a range of prebuilt strategies tailored to match your market sentiment.

Ready-Made Strategies

Create Your Strategy

Customise your trades by adding contracts of your choice to build your own strategy.

Create Your Strategy

Save Your Strategy

Save a strategy to place trades later or track its performance without executing trades.

Save Your Strategy

Brokers we support

FyersUpstoxZerodhaGrowwFyersUpstoxZerodhaGroww

Advanced option chain analysis and Multi Strike OI charts

Option Chain

Analyse contracts from the options chain across every metric. Add contracts to a basket for a multi-leg strategy, or quick-trade a contract directly from the option chain.

Try it Now
Strength Identified
Fridays Are Your Best Day

You make an average of 6849 on Fridays with 100.0% win rate.

+₹27,394Estimated Impact
Strength Identified
Morning Entries Outperform

Trades opened before 10:30 AM close green 78.4% of the time.

+₹19,120Estimated Impact
Strength Identified
Tighter Stops Pay Off

Capping risk at 1.2% per leg cuts your worst drawdowns in half.

+₹12,860Estimated Impact
Strength Identified
Trend Days Favour You

Your edge holds strongest when the index trends above its VWAP.

+₹8,415Estimated Impact

Open Interest Analysis

Analyse the open interest of different strike prices across different expiry dates.

Try it Now

Performance By

Market RegimeDay of Week
100%80%60%40%20%0%
46%
Mon
Tue
Wed
Thu
Fri
Strategy Builder

Build strategies the way you think.

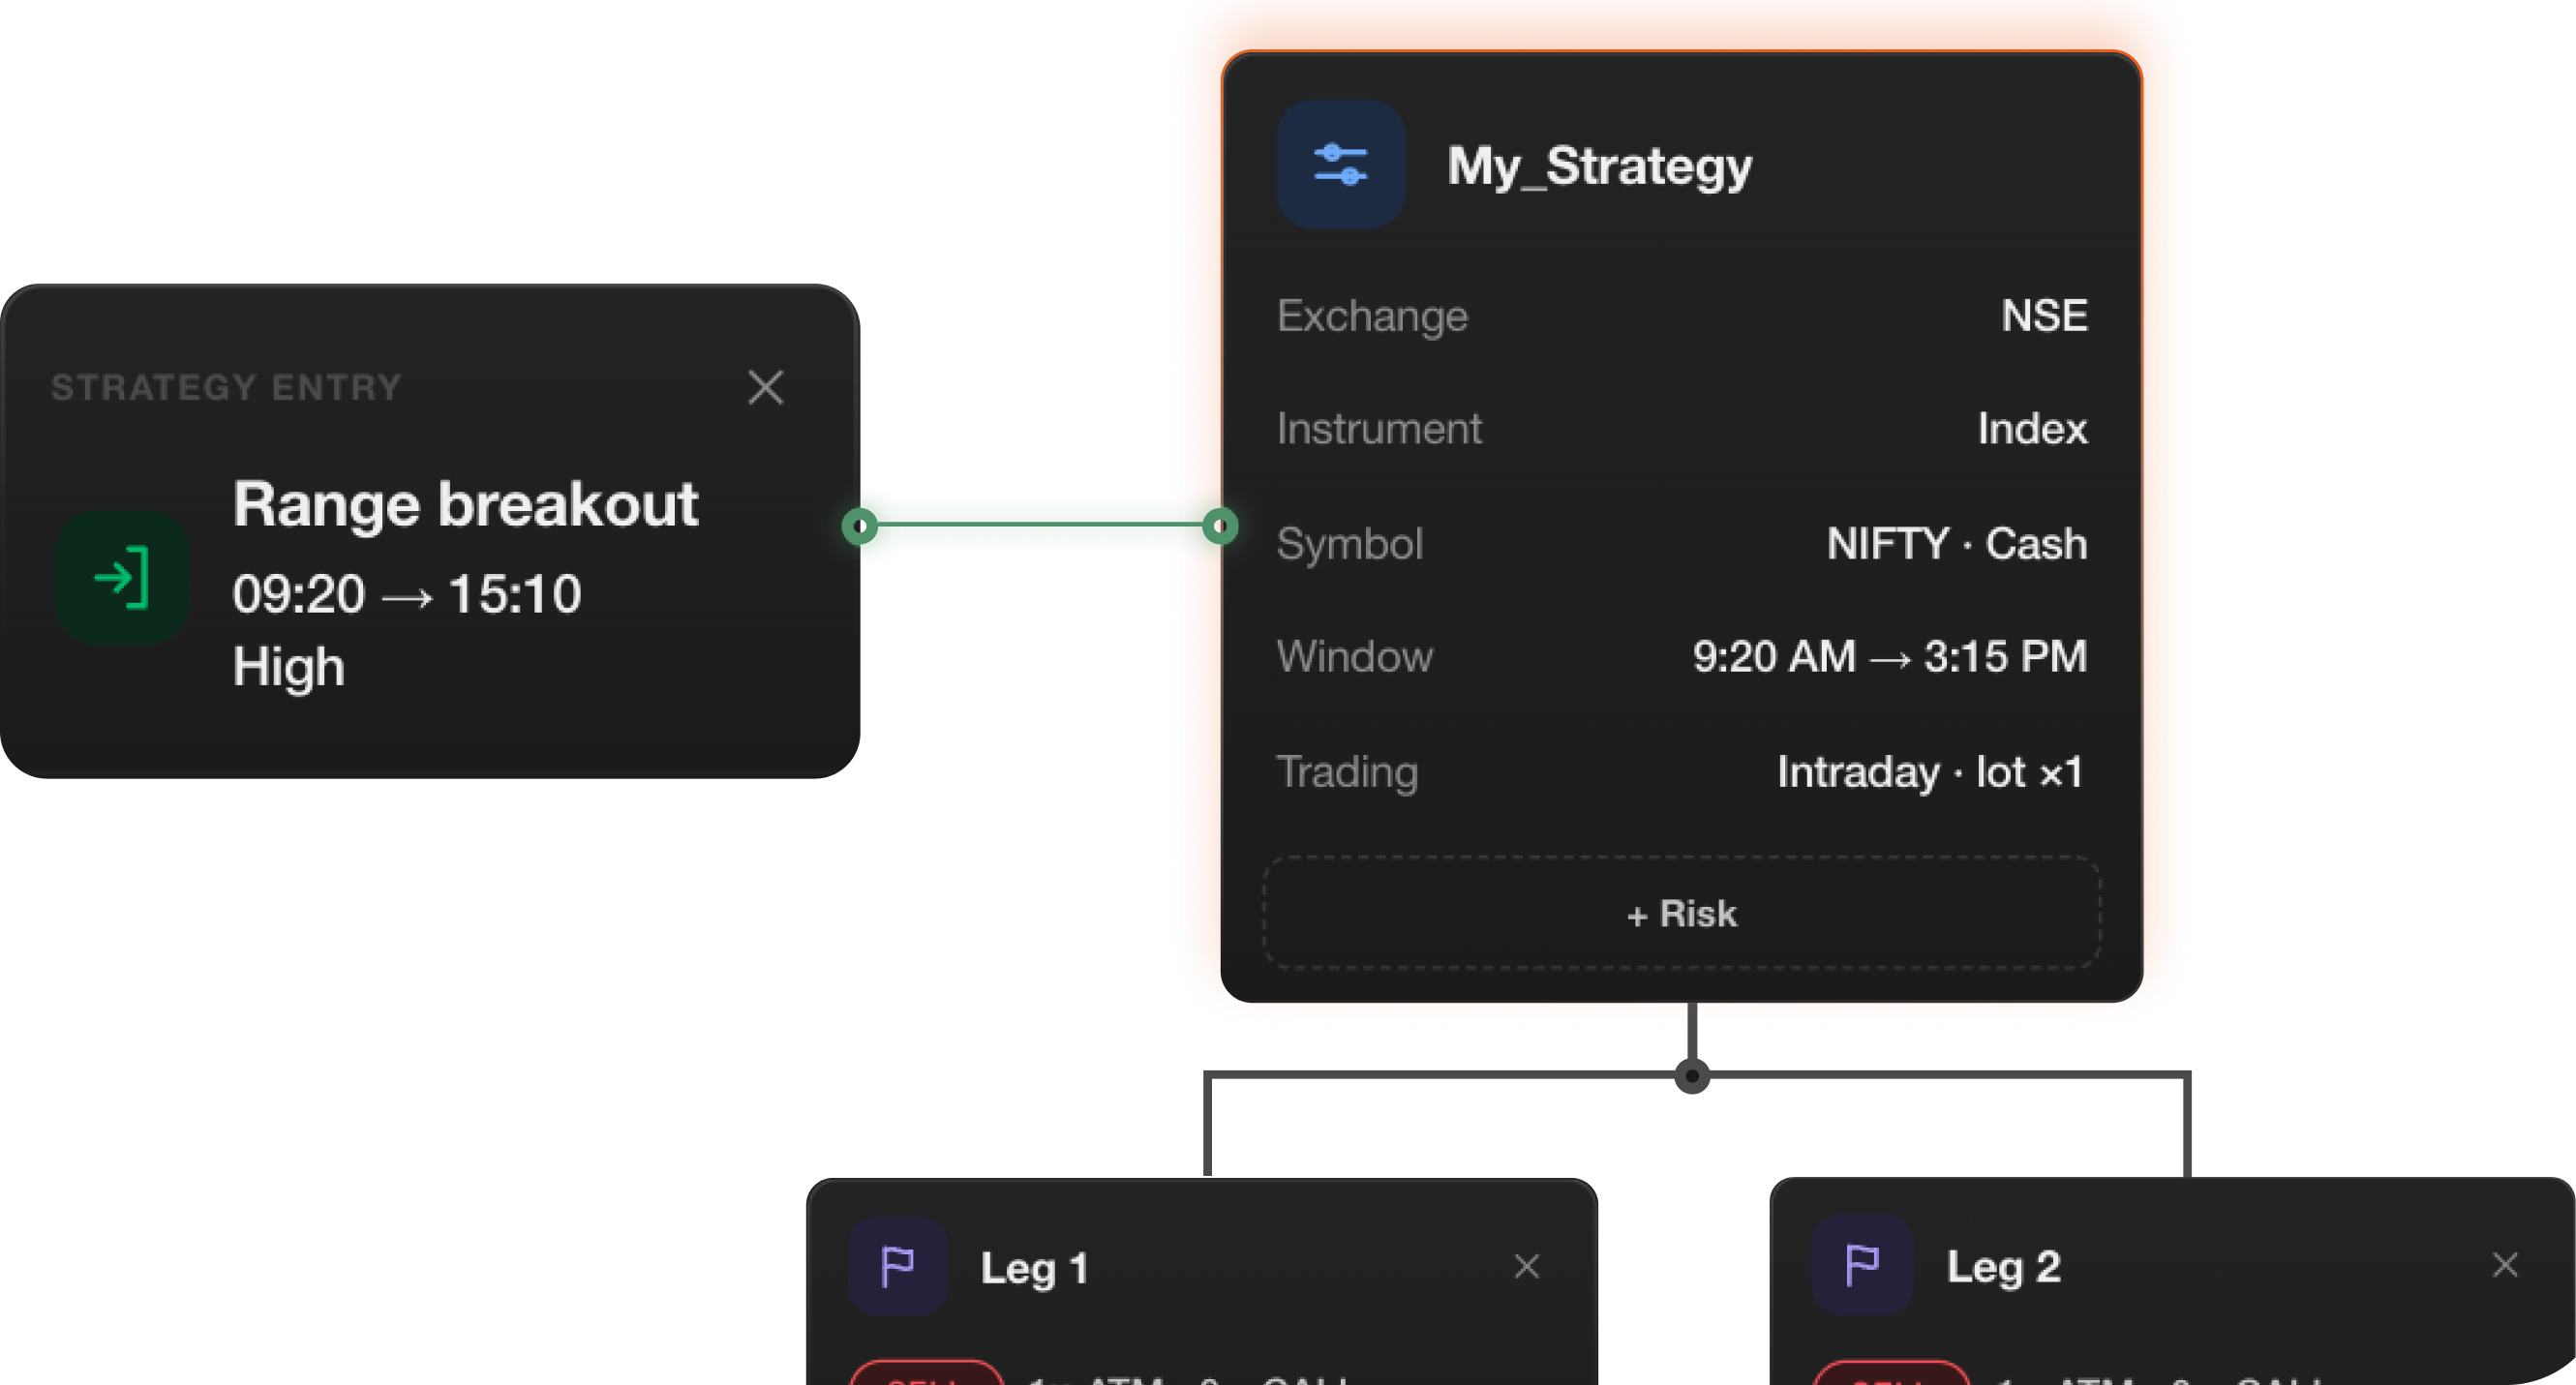
The Strategy Builder is a canvas. Drop blocks, wire them together, and watch your strategy take shape in real time.

My Strategy
SymbolNIFTY · Cash
Window9:20 AM → 3:15 PM
TradingIntraday · lot x1
+ Strategy Entry+ Risk
Leg 1×
SELL1× ATM CALL
+ Exit
Leg 2×
SELL1× ATM CALL
+ Exit

See the whole strategy on one infinite canvas.

Pan, zoom, and spread out however you think. What's hard to hold in your head reads at a glance as a diagram — an orphaned block is obvious before you ever backtest.

A block for every piece.

Entries, legs, exits, filters — each is its own titled, color-coded block.

Wire up the logic — literally.

Drag connections between blocks to define how they relate. The wires are the logic.

Edit in the side panel — canvas stays clean.

Select a block to open its details beside the canvas. Adjust strikes, stops, and conditions there.

Group legs, share the logic.

Branch one stop, filter, or rule across a whole group of legs — set it once, and every leg follows.

Build, analyse, and execute

Start a conversation with us